Project Objectives

Develop a decision support tool to identify areas compatible with utility scale solar energy development.

Identify and produce recommendations for implementing model results.
Significance
 Energy source by sector in California's Renewable Energy Portfolio assuming an RPS of 50%.
Renewable energy is going to play a large role in the development of
energy for California, with legislative support directing the state towards a
renewable energy future. The graph to the right shows the predicted growth of solar PV within California's renewable energy portfolio, which is expected to be higher than all other renewable energy sources. By 2030, PV is expected to make up 18% of all energy within California. This has led to a dramatic increase in the number of
proposed PV projects in California, in some cases before the full environmental
impacts are known. This project contributes to the conservation planning efforts within California and nationally that are designed to solve problems at the energy-conservation nexus. Notably, this project adds to The Nature Conservancy’s Western San Joaquin Valley Solar Assessment and the Desert Renewable Energy Planning Process in the California Desert.
Study Area
 Study area (click to enlarge).
All eight counties on the San Joaquin Valley floor (San Joaquin, Stanislaus, Merced, Madera, Fresno, Kings, Tulare, and Kern) were included in this analysis constrained in the east by the Sierra Foothills and in the south by the Transverse Ranges. Parts of San Luis Obispo, Monterey, Santa Barbara, San Benito, and Ventura counties were added to include biologically sensitive areas where solar development has been previously proposed.
Develop a decision support tool that identifies areas compatible with utility scale solar energy

The WildLight Model was built using the Environmental Evaluation Modeling system, a spatial model platform developed by the Conservation Biology Institute. This model allows for the integration and comparison of widely varied data types yielding outputs that are simple and easily interpreted maps. Additionally, the model utilizes the best available data and is designed to be highly adaptable and capable of incorporating new data as it becomes available. Below is a diagram of the model structure. Our spatial analysis unit was 1 kilometer squared.


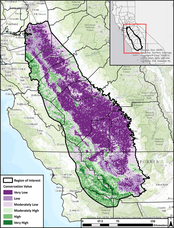
Model Characteristics

Conservation Value: Geographic distribution of threatened and endangered species, biodiversity, habitat condition, and critical habitats (e.g. wetlands).
|

Solar Suitability:
Proximity and density of existing transmission infrastructure, solar insolation, and areas with less than a 6 degree slope. 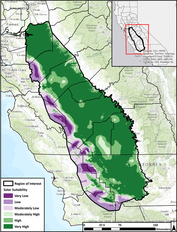
|

Agricultural Value:
Soil productivity, water cost and reliability, microclimate, environmental sensitivity, urban growth pressure, and rangeland value. 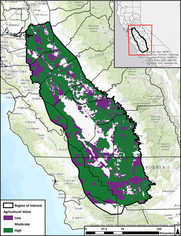
|

|

|

|

All three maps combine to produce Compatible Areas for Solar Development.
Key Results
Urban areas: As built environments, urban areas are inherently low in agricultural and conservation value and contain high densities of transmission infrastructure. New ways of funding rooftop solar has lead to an increase in its deployment across California. This is an encouraging trend that will reduce the pressure on high value conservation and agricultural lands and make use of the built environment for solar energy generation.
Westlands Water District: The Westlands Water District is located in the western San Joaquin Valley. Efficient agricultural cultivation in this region has become increasingly difficult due to highly saline soils, lack of access to drainage, and decreasing federal water allocations. Due to the convergence of these factors, a record high 206,000 acres of agricultural land was fallowed in 2014. This trend is likely to continue as the current drought continues in the short term, and the projected climate becomes hotter and drier in the long term. Solar development in this region would benefit land owners by providing an alternative to strategically fallowing lands every year, thereby providing a more stable revenue source. Additionally, as some areas within the district convert to solar energy generation the demand on water will decrease, allowing robust agricultural cultivation to continue within the region.
Westlands Water District: The Westlands Water District is located in the western San Joaquin Valley. Efficient agricultural cultivation in this region has become increasingly difficult due to highly saline soils, lack of access to drainage, and decreasing federal water allocations. Due to the convergence of these factors, a record high 206,000 acres of agricultural land was fallowed in 2014. This trend is likely to continue as the current drought continues in the short term, and the projected climate becomes hotter and drier in the long term. Solar development in this region would benefit land owners by providing an alternative to strategically fallowing lands every year, thereby providing a more stable revenue source. Additionally, as some areas within the district convert to solar energy generation the demand on water will decrease, allowing robust agricultural cultivation to continue within the region.
Identify and produce recommendations for implementing model results

The findings of this analysis provide planners, developers, and stakeholder groups with a more comprehensive examination of the San Joaquin Valley and highlights areas for utility scale solar development that are compatible with agricultural and conservation values. These results provide a starting point for upcoming planning processes on both the state and county level, with this model’s flexibility allowing it to remain up-to-date as new data becomes available. The ultimate goal of this assessment is that these results will be formally incorporated into the solar development planning process.

Mitigation areas: The results of the Conservation Value model can be applied to the process of selecting mitigation areas for utility scale solar projects deemed to have a high impact on the landscape. The map produced though our analysis highlights areas of ecological importance that are important on scales ranging from individual species to ecosystems to the entire landscape. These areas are spread throughout the study area and represent high value areas in a developed landscape.
Next Steps: Data Sharing, Participation in a State Planning Process, Direct Outreach, and
Refining Model with Stakeholder Input.
Next Steps: Data Sharing, Participation in a State Planning Process, Direct Outreach, and
Refining Model with Stakeholder Input.
